
Reviewed.com's New and Improved Headphone Scoring
Updates, refinements, and a big "welcome!" to wireless headphones
 Credit:
Reviewed.com
Credit:
Reviewed.com

Recommendations are independently chosen by Reviewed's editors. Purchases made through the links below may earn us and our publishing partners a commission.
Hey there, headphone aficionados! In the interest of transparency and scientific rigor, we want to let you know that some of our headphone scoring methodologies have been updated.
While we are following the same philosophies (and in most cases collecting the same data) that we have for years, these updates will help us to streamline our testing process and better account for the changing sound signatures of today's consumer headphones.
Related content

What Hasn't Changed
All of our test data collection procedures remain unchanged. The changes to the scoring of the performance data include a more robust analysis of the same data that we have been collecting for years, meaning we've also gone back and updated the older scores as well.
What Has Changed: Frequency Response
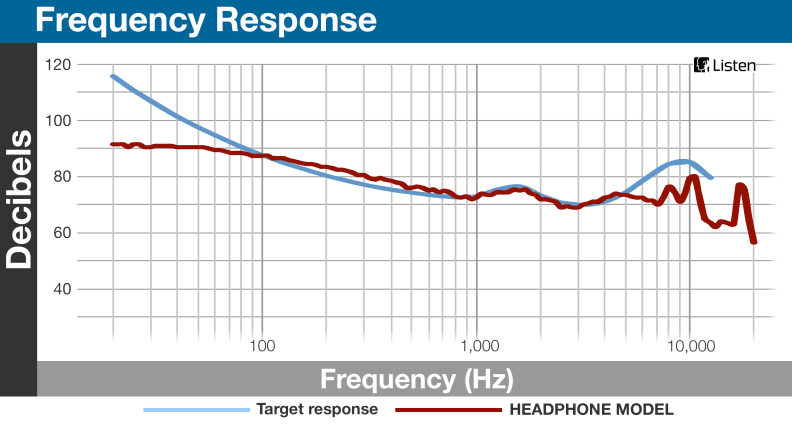
The frequency response test quantifies which frequencies are emphasized or de-emphasized in a given pair of headphones. With all headphones, manufacturers choose to make certain frequencies louder (that is, make them have a higher decibel value), and certain frequencies softer (lower decibel value). While everyone’s preferred frequency loudness is unique, there are two philosophical ideals that we compare a product’s frequency response to: the Equal Loudness Curve (ELC) and Studio Limits (SL).
Since people naturally pick up certain frequencies better than others, the ELC is defined by an international standard (ISO 226:2003) that is designed so that every frequency sounds equally loud to most people. Most consumer headphones aim to achieve this kind of frequency response profile, so that a pair of headphones works well across a variety of genres.
With some products—especially those designed for use in a studio—a flat frequency response is more appropriate. This is especially useful in a professional environment where you want to mix without the headphones changing the sound profile.
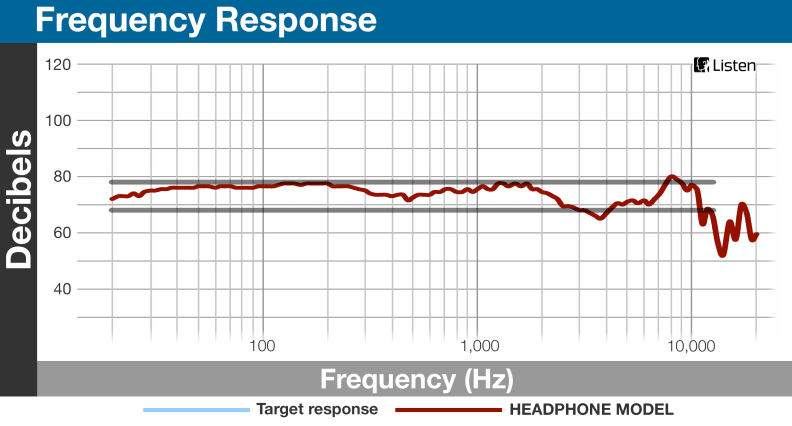
This frequency response fits almost entirely within the Studio Limits; this product's frequency response score is close to 10 out of 10.
In previous years, we have judged the frequency response of all headphones against the studio limit standard. With our new ELC standard, we look at the frequency data (over a range of 20-12,500 Hz), as well as the product specs, and decide which standard that pair of headphones was aspiring to recreate—ELC or SL—and score it accordingly.
This frequency response closely matches the Equal Loudness Curve, and subsequently, this product has a frequency response score that is close to 10 out of 10.
This means that we can better judge how faithful a pair of headphones is to the standard that it originally set out to replicate, and score them accordingly.
What Has Changed: Tracking
Tracking is defined as the difference in the dB level between the left and right sides of a pair of headphones at a given frequency. Ideally, the difference is 0 dB, and both sides of the headphone have identical loudness values. However, in the real world, we expect to see some tracking differences.
Before, we calculated the tracking score based on the single largest deviation in dB between the left and right sides of a pair of headphones. Now, we look at all of the tracking differences from 20-10,000 Hz. In this manner, we can quantify tracking changes across the entire frequency range, and give readers a more accurate description of how noticeable any tracking deviations will be at a given frequency.
We operate under the assumption that a 2 dB difference between your left and right ear would be impossible to notice, so if the tracking differences are consistently within the bounds of +/- 2 dB, then the tracking score is a 10 out of 10.
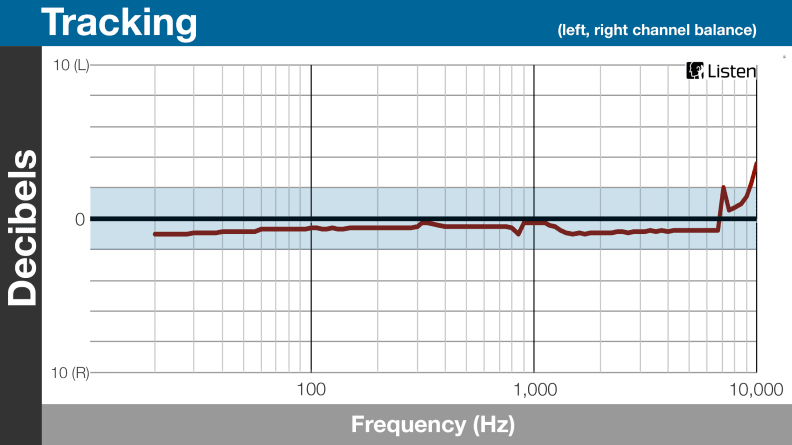
This product's tracking values are almost entirely withing the +/- 2 dB limit; this tracking score is very close to 10 out of 10.
On the other hand, large tracking differences can make your music sound distractingly terrible. Accordingly, any tracking differences larger than +/-2 dB detract from the overall tracking score.
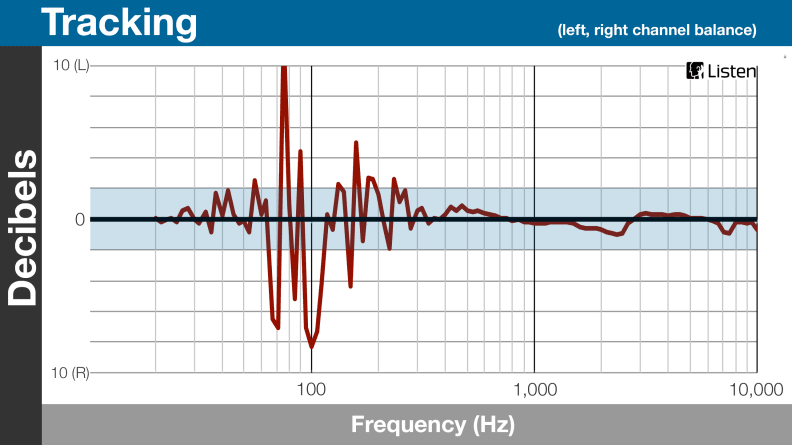
This product's tracking values spend a lot of time outside our +/- 2 dB limit; this tracking score is very low.
What Has Changed: Distortion
Distortion is the result of headphones that truncate or alter the waveforms that comprise the music you're actually playing. For a given pair of headphones, we record the difference in amplitude between the input (the song as it is digitally stored in your iPod) and the output (the song rendered as sound waves through your headphones) over a frequency range of 20-10,000 Hz.
The differences are recorded as a percentage of the original amplitude of the digital waveform; larger distortion values mean that the original waveform was heavily altered (and therefore, is now different from the way it is supposed to sound) by the time it reached your ears.
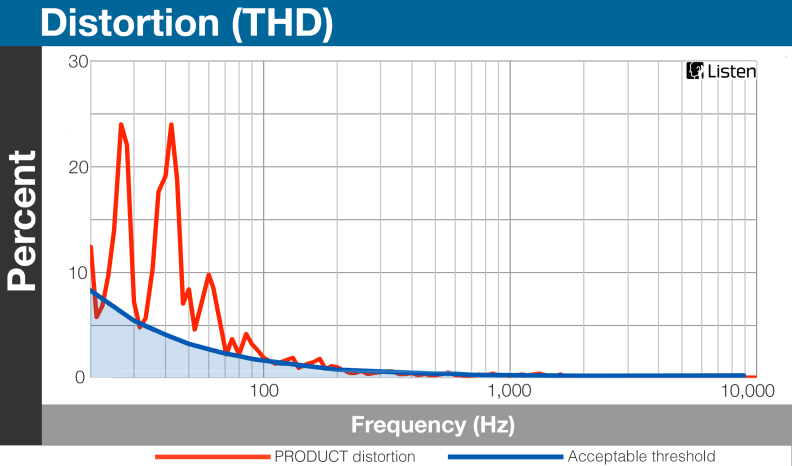
These distortion values surpass our empirical distortion curve; the distortion score for this product is very low.
Before, we scored distortion based on the value that was the result of averaging distortion over all frequencies. In this new methodology, we have developed an empirical distortion curve. This curve is based on distortion data from previously-tested products. This new differentiation allows us to distinguish which products have distortion that will noticeably affect your music, and which products do not. The more a product’s distortion curve falls above our empirical distortion curve, the more noticeable that distortion is.
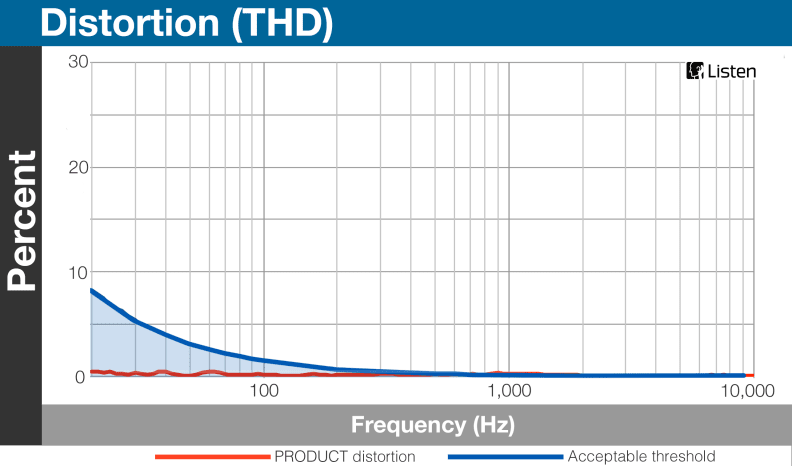
These distortion values stay almost entirely below the empirical distortion curve; this product's distortion score is close to a 10 out of 10.
What Has Changed: Wireless Headphone Testing
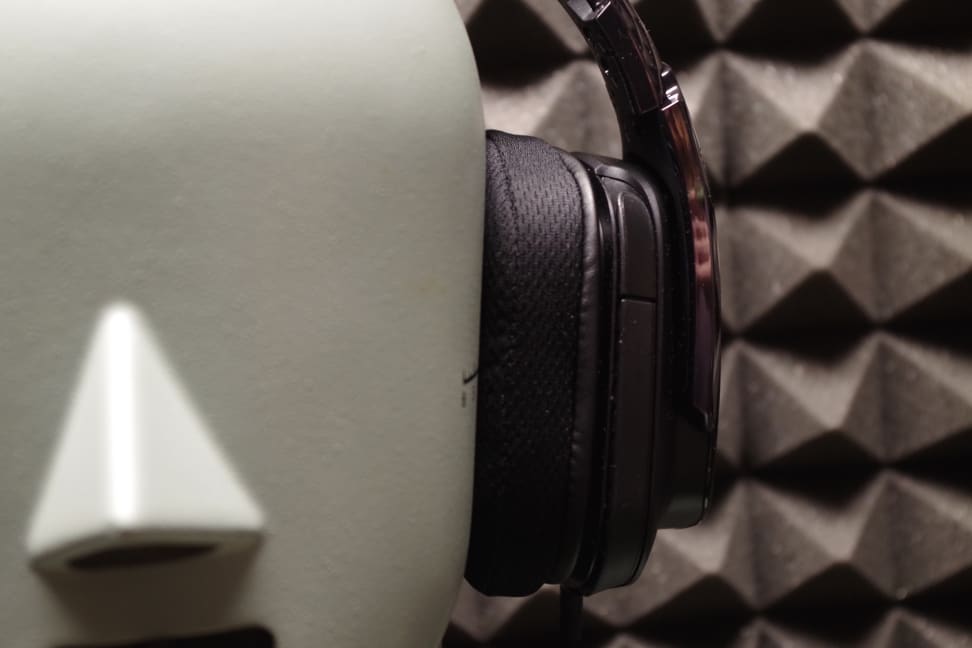
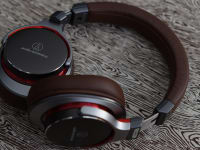
Up until now, we've only been able to test the performance of headphones that feature some kind of wired connection. Fortunately, we have just acquired testing equipment from Listen, Inc. that will allow us to gather the same performance data—frequency response, distortion, tracking, maximum sound level, leakage, and isolation—for purely wireless headphones. Additional points of consideration will be based on the wireless specifications, such as range and battery life, and day-to-day usage, such as portability and durability.
What Will The Changes Look Like?
The only visible changes are going to be to the plots for “Frequency Response”, “Distortion”, and “Tracking”, shown on the “Test Results” page of each review going forward. As shown in the above examples, the charts will now include both the product's data, and their respective comparison curves, whether it’s the ELC and SL standards, the +/- 2 dB tracking difference boundaries, or our empirical distortion curve. Also, keep your eyes peeled for the commencement of our wireless headphone coverage!
These methodology changes, which are now currently in use, have also been applied retroactively to all of our older products, resulting in the updated scores and ranks now visible on the website. We can now assess both the performance and the intangibles of a pair of headphones more accurately, which in turn helps us to give you, our readers, a solid, data-driven recommendation for your next pair of headphones!
Related Video
{{brightcove '4620055440001'}}